Selecting data object files
Analytic dashboards display data from BIRT data objects. Data visualization and data selection gadgets require a data object file. Each gadget displays data from one data set or data cube in the selected data object.
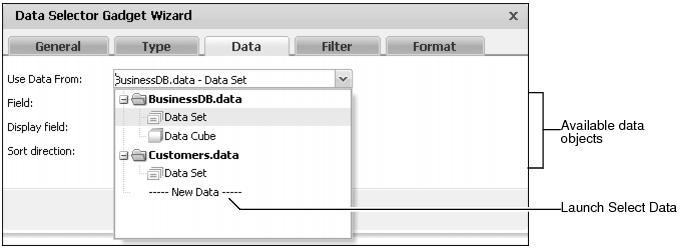
After a data object is used in a user’s dashboards, it appears as an available data object, as shown in Figure 4-2.

A data set contains rows of data that are not aggregated. Gadgets such as summary tables and charts can aggregate the data from a data set. BIRT designers can assign analysis types to data columns in a data set. Analysis types identify associated values and measures that a user can use when aggregating the data.

A data cube contains data that is already aggregated into dimensions, attributes, and measures of data and is optimized for data analysis.
To add additional data objects, choosing New data launches Select Data to browse and select from all available data objects. Figure 4-3 shows an example of browsing available data objects.
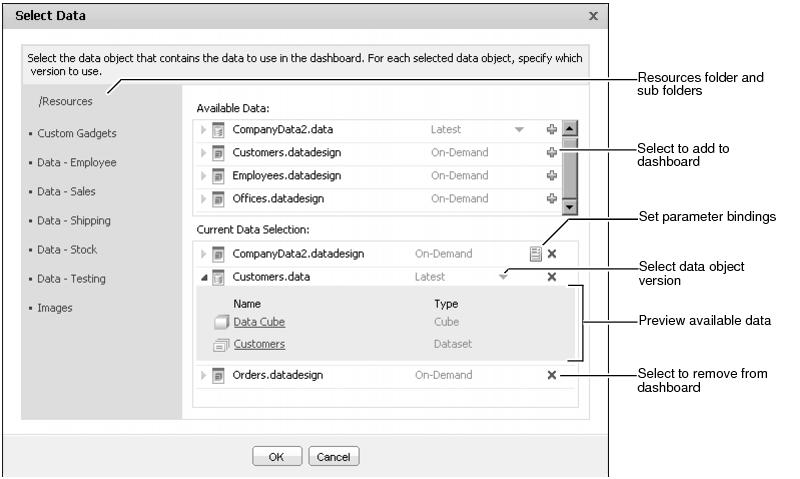
When previewing data sources to add to a gadget, you can browse the structure of data sets and data cubes. Select Data also appears when you select Manage Data from the dashboard menu.
Figure 4-4 shows an example of browsing a data set in a data object file.
Data sets can contain one or more data fields that display as columns in gadgets.
Figure 4-5 shows an example of browsing a data cube inside a data object file.
Data cubes contain the following data categories that can display in gadgets:

|
n
|
Levels: data columns associated with dimension groups. For example, levels named country, state, and city can be part of a dimension named location.
|

|
n
|
Dimensions: groups of levels, such as location or time periods. For example, a dimension named order date can contain dates in levels such as year, quarter, and month.
|

BIRT report developers add these categories when they design the data object.
The selected data structure loads into a gadget for the user to assign to parts of the gadget. For example, after loading a customer data set to a table gadget, the different fields in the data set, such as customer name and email address, appear in the gadget’s data settings.