Editing a cross-tab gadget
The cross-tab gadget displays cube data from a data object using a cross tab. Users can analyze the cross tab using BIRT Data Analyzer.
Dashboard designers can customize cross-tab gadget options using the Crosstab Builder—General options. For more information about general options, see Setting general gadget options, earlier in this section.
Assigning data to a cross-tab gadget
Cross-tab gadgets display data from data cubes in BIRT data objects. Crosstab Builder—Data appears when the user adds this gadget to a dashboard or edits it, as shown in Figure 4-41. Users select a data cube from data objects already used on the dashboard. If the data object is not shown, the user adds a new data object to the dashboard, then selects a data cube.
Select Use default hyperlink to display hyperlinks contained in data object. BIRT report designers can add hyperlinks to a data object using BIRT Designer Professional.
The dashboard designer assigns data to parts of the cross tab. Dimensions and attribute levels are assigned to rows or columns of the cross tab. Measures are assigned to summary fields.
Dashboard designers can also limit the data that appears in the gadget by using Crosstab Builder—Filter to create filter conditions. For more information about filtering, see Filtering data source in gadgets, earlier in this section.
Formatting a cross tab gadget
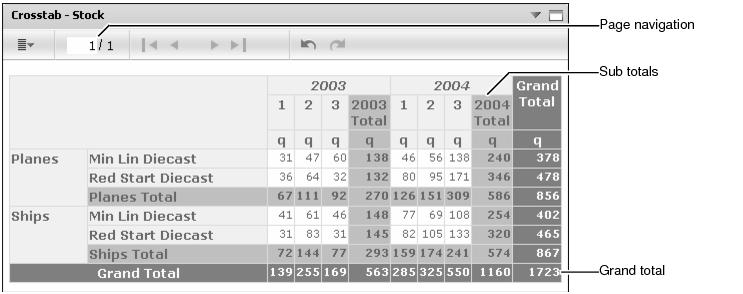
You can format a cross-tab gadget to modify its appearance on a dashboard. Figure 4-42 shows the elements of a cross tab that you can modify.
Choose edit from the gadget menu or create a new gadget to open Crosstab Builder. In Crosstab Builder, select Crosstab Builder—Format to see formatting options. Figure 4-43 shows the formatting options available for a cross-tab gadget.
Cross tab formatting supports the display of grand totals and subtotals for all rows and columns that contain two or more dimensions. Enabling page breaks inserts them at the selected column and row intervals.
Maximizing a cross-tab gadgets launches the browser-based tool BIRT Data Analyzer to analyze and edit the cross tab.