Editing a Flash gadget
Flash gadgets display data from a selected data object file as an Adobe Flash-based image.
Dashboard designers can customize flash gadget options using the Gadget Builder—General options. For more information about general options, see Setting general gadget options, earlier in this section.
When adding or editing a flash gadget, you can change the Flash type displayed in the gadget, as shown in Figure 4-44.
Assigning data to Flash gadgets
Editing or adding an Adobe Flash gadget to a dashboard displays Gadget Builder—Data, where the developer selects data to display. A flash gadget can display any data set or data cube from a data object file.
Dashboard designers can also limit the data that appears in the gadget by using Gadget Builder—Filter to create filter conditions. For more information about filtering, see Filtering data source in gadgets, earlier in this section.
If hyperlinks exist in the data object file, they can appear in the gadget by selecting Gadget Builder—Data—Use default hyperlink.
Dashboard designers can use aggregate expressions to summarize data set values. Table 4-3 shows the aggregate expressions available in flash gadgets
The developer assigns data to the different parts of the gadget. Each Flash gadget type has a different way of presenting data.
Linear and meter Flash gadgets support multiple values and data aggregation, as shown in Figure 4-45.
Bullet, cylinder, and thermometer Flash gadgets support a single value and data aggregation, as shown in Figure 4-46.
Spark line flash gadgets support a single value and selecting a second value for grouping the data, as shown in Figure 4-47.
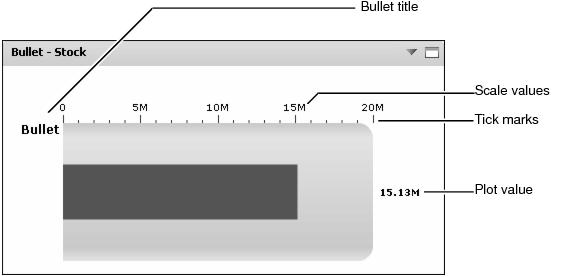
Formatting a bullet gadget
You can format a bullet gadget to modify its appearance on a dashboard. Figure 4-48 shows the formatting elements that you can modify.
Choose edit from the gadget menu or create a new gadget to open Gadget Builder. In Gadget Builder, select Gadget Builder—Format to see formatting options. The following formatting options are available for a bullet gadget:
|
n
|
Change the appearance of the gadget using the Region and Tick Marks options, as shown in Figure 4-51.
|
The dashboard designer can select colors for the gadget, the font used, and the regions in the bullet gadget. For more information about selecting colors, see Using the color picker, earlier in this section.
Formatting a cylinder gadget
You can format a cylinder gadget to modify its appearance on a dashboard. Figure 4-52 shows the elements you can modify.
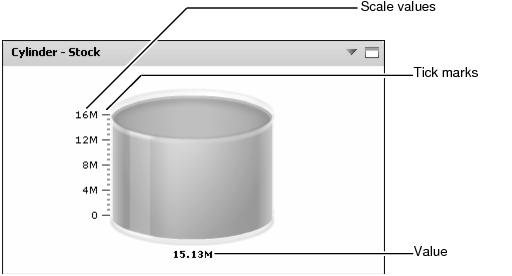
Choose edit from the gadget menu or create a new gadget to open Gadget Builder. In Gadget Builder, select Gadget Builder—Format to see formatting options. The following formatting options are available for a cylinder gadget:


The dashboard designer can select colors for the gadget and the font used in the cylinder gadget. For more information about selecting colors, see Using the color picker, earlier in this section.
Formatting a linear gauge gadget
You can format a linear gauge gadget to modify its appearance on a dashboard. Figure 4-56 shows the elements you can modify.
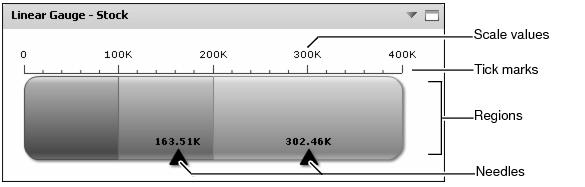
Choose edit from the gadget menu or create a new gadget to open Gadget Builder. In Gadget Builder, select Gadget Builder—Format to see formatting options. The following formatting options are available for a linear gauge gadget:
|
n
|
Change the appearance of the gadget using the Region and Tick Marks options, as shown in Figure 4-59.
|
The dashboard designer can select colors for the gadget, the font used, and the region in the linear gauge gadget. For more information about selecting colors, see Using the color picker, earlier in this section.
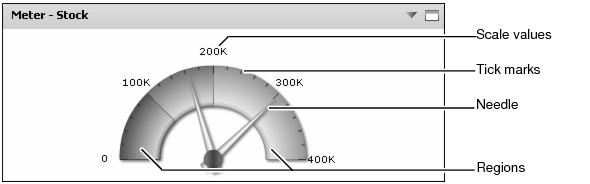
Formatting a meter gadget
You can format a meter gadget to modify its appearance on a dashboard. Figure 4-60 shows the formatting elements you can modify.
Choose edit from the gadget menu or create a new gadget to open Gadget Builder. In Gadget Builder, select Gadget Builder—Format to see formatting options. The following formatting options are available for a meter gadget:
|
n
|
Change the appearance of the gadget using the Region and Tick Marks options, as shown in Figure 4-63.
|
The dashboard designer can select colors for the font used and the regions in the meter gadget. For more information about selecting colors, see Using the color picker, earlier in this section.
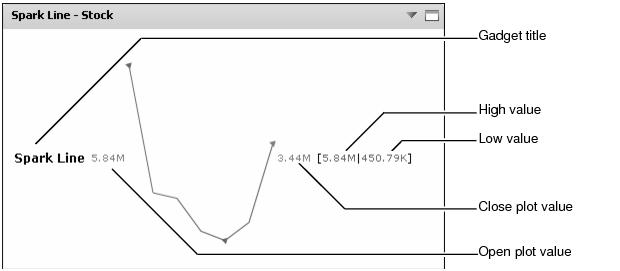
Formatting a spark line gadget
You can format a spark line gadget to modify its appearance on a dashboard. Figure 4-64 shows the formatting elements you can modify.
Choose edit from the gadget menu or create a new gadget to open Gadget Builder. In Gadget Builder, select Gadget Builder—Format to see formatting options. The following formatting options are available for a spark line gadget:
The dashboard designer can select a color for the font used in the spark line gadget. For more information about selecting colors, see Using the color picker, earlier in this section.
Formatting a thermometer gadget
You can format a thermometer gadget to modify its appearance on a dashboard. Figure 4-67 shows the formatting elements you can modify.
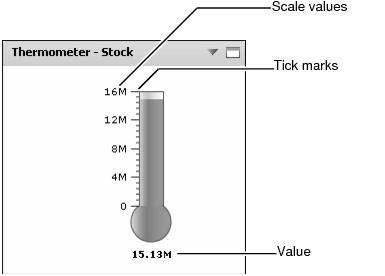
Choose edit from the gadget menu or create a new gadget to open Gadget Builder. In Gadget Builder, select Gadget Builder—Format to see formatting options. The following formatting options are available for a thermometer gadget:

The dashboard designer can select colors for the gadget and the font used in the thermometer gadget. For more information about selecting colors, see Using the color picker, earlier in this section.