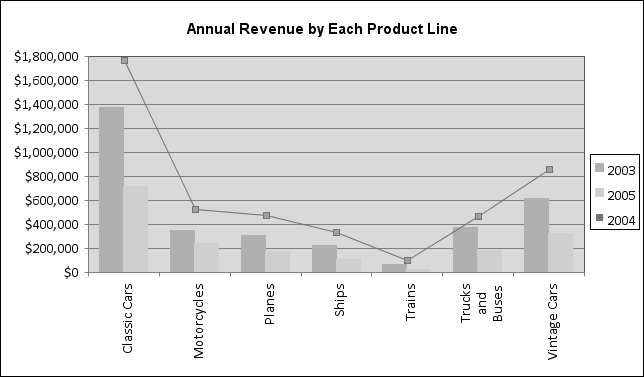
combination chart
In BIRT and spreadsheet reports, a chart in which multiple data series appear as different chart types. In Figure G-20, for example, the data series for 2004 appears as a line, which stands out as the year of highest annual revenue.
Figure G-20 Combination chart
Related terms
Actuate e.Spreadsheet technology, Business Intelligence and Reporting Tools (BIRT), chart, data, series
Contrast with
base chart, chart control, chart element, dual y-axis chart, flash chart element, hyperchart, study chart

