About cross tabs
A cross tab, or cross tabulation, displays data in a row-and-column matrix similar to a spreadsheet. A cross tab is ideal for concisely summarizing data. A cross tab displays aggregate values such as averages, counts, or sums in the cross tab’s cells.
Figure 3-1 shows a cross tab that organizes state groups in the row area and product line groups in the column area. Aggregate revenue values appear in the cells of the data area.
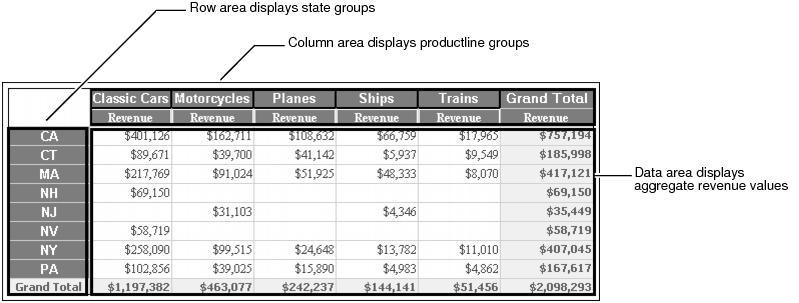
Figure 3-1 Viewing a cross tab
A cell displays a revenue value by product line and by state, as shown in Figure 3-2.
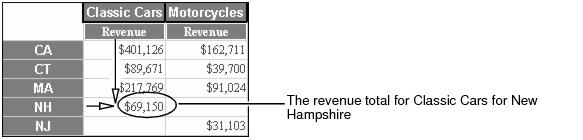
Figure 3-2 A cell displaying a revenue total
A cross tab uses data from at least three fields. The cross tab in Figure 3-1 uses the following data fields:
|
n
|
One field provides the values for column headings in the cross tab. The cross tab displays one column for each unique value in the field. In Figure 3-1, the cross tab displays five unique values from the productline field: Classic Cars, Motorcycles, Planes, Ships, and Trains.
|
|
n
|
One field provides the values for row headings in the cross tab. The cross tab displays one row for each unique value in the field. In Figure 3-1, the cross tab displays eight unique values from the state field: CA, CT, MA, NH, NJ, NV, NY, and PA.
|
|
n
|
BIRT Data Analyzer aggregates one field’s values, and displays these values in the cross tab cells. In this example, each cell displays a revenue total by product line and state. Data Analyzer calculates the revenue total using the SUM function on the values in the extendedprice field.
|