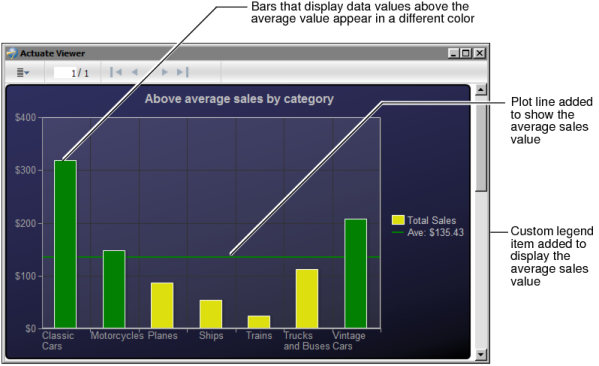
The bar chart in Figure 15-12 shows the following custom options that are added through scripting:
|
|
A script in beforeDrawSeries( ) calculates the average sales total, and changes the color of bars that show data values above the average value.
|
|
|
A script in afterRendering( ) draws a plot line on the y-axis to show the average value, and adds a legend item to display the average value.
|
|
Figure 15-12
|
// Assuming aveValue was set in the beforeDrawSeries function, draw a plot line at the average value