Flash charts are charts that use visual effects and animation. Actuate BIRT Designer supports the creation of Flash charts, HTML5 charts, and BIRT charts. BIRT charts are static images whereas Flash and HTML5 charts add motion and more visual interest. For example, an animated Flash column chart can progressively draw its columns from the bottom to the top and its x-axis labels from left to right. For a comparison of Flash and HTML5 charts, see Chapter 15, “Building HTML5 charts.”
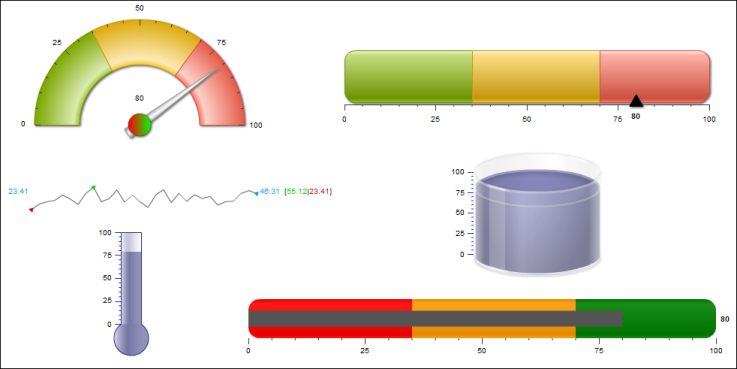
Actuate BIRT Designer provides these Flash chart types: column, bar, line, pie, and doughnut. Like Flash charts, Flash gadgets display data graphically and with animation. The difference between the two elements is that a gadget typically displays a single value whereas a chart plots multiple values for comparison. The supported Flash gadgets, shown in Figure 17-1, are meter, linear gauge, sparkline, cylinder, thermometer, and bullet.
|
Figure 17-1
|