Plot properties control the appearance of elements in the data plot area of bullet and sparkline gadgets. For a bullet gadget, you can add a border around the gadget or a shadow below it. You can also specify whether to display the value label and whether to display the value indicator as a line or as a dot.
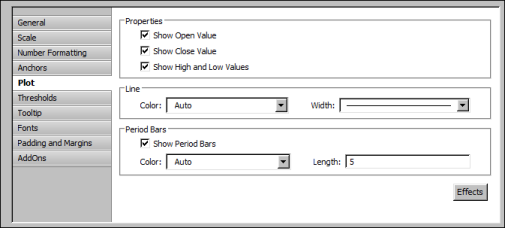
For a sparkline gadget, you can specify whether to display the first, last, lowest, or highest values, change the color and width of the data line, and add bars in the background to represent period blocks. For example, if a sparkline displays daily stock quotes over a month, you can show period blocks that have a length of 5 to divide the stock values into weeks. The value of 5 assumes that each week has five trading days.
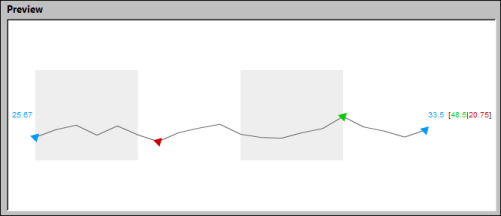
For example, Figure 17-16 shows the preview of a sparkline gadget. The gadget displays period bars where each period contains five values. Alternate bars appear in color.
|
Figure 17-16
|
Figure 17-17 shows the plot properties specified for the plot that appears in the sparkline gadget example shown in Figure 17-16.
|
Figure 17-17
|
Table 17-10 shows all the plot properties.
|
Table 17-10
|
Sets the color of the period bars. The color is applied to alternate bars.
Sets the number of values that each period bar highlights.
Enables or disables the display of the value indicator as a dot instead of a solid line.
Enables and disables the display of the close value.
Show High and Low Values
Enables and disables the display of the high and low values.
Enables and disables the display of the open value.
Enables or disables the appearance of a shadow below the gadget.
Enables or disables the display of the value on the gadget.