Threshold properties define thresholds, which you use to identify meaningful values. For example, in a linear gauge that displays a sales total, you can add a threshold that identifies the target sales amount, as shown in Figure 17-14. By displaying this threshold value, the gauge shows whether the actual sales total is over or under the sales target.
Figure 17-14 also shows the threshold properties set to create the threshold. You can specify a label, create a threshold line or a threshold zone, specify a threshold value or range of values, and format the line and marker. You can create multiple thresholds for a gadget.
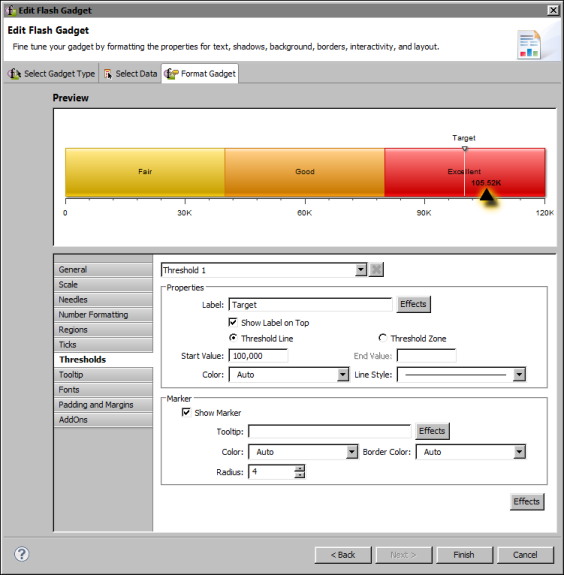
Table 17-8 shows all the threshold properties and lists the gadgets to which they apply.
|
Table 17-8
|
Linear gauge, meter, sparkline
Linear gauge, meter, sparkline
Linear gauge, meter, sparkline
Show Value Inside
Show Value on Top
Linear gauge, meter, sparkline
Threshold Line/Threshold Zone