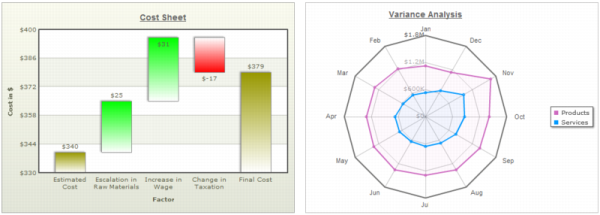
Flash power charts are specialized charting widgets that provide unique ways to present data. Charts, such as the drag-node, logarithmic, radar, kagi, and waterfall chart can be used for a wide variety of purposes, including simulations, scientific plotting, financial analysis, and hierarchical diagrams.
Figure 18-4 shows examples of power charts.
|
Figure 18-4
|