|
Task 10:
|
In this procedure, create the dataURL variable to pass the XML data generated by the plug-in to the Flash chart.
The first argument, CombChartXMLFormat, is the format specified in the extension properties of the plug-in. The second argument, true, specifies that the URL is encoded. The third argument, null, specifies that there are no custom parameter names and values to pass to the URL.
|
9
|
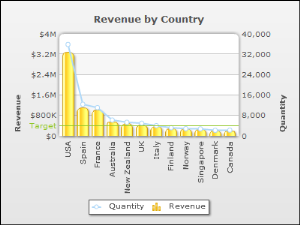
Preview the report. The Flash chart should look like the one shown in Figure 18-34. The chart has two y axes. The left axis displays revenue values and the right axis displays quantity values. The column chart presents revenue data and the line chart presents quantity data.
|
|
Figure 18-34
|