All Flash objects are controlled by XML properties. You must use XML to provide data to a Flash object and to define the visual and functional properties of a Flash object. Unlike the Flash charts and gadgets that you create using the Flash chart and Flash gadget elements, an object in the Flash library cannot access data directly from a data set. After creating a data set to retrieve data from a data source, you write code that accesses the data and converts it to the required XML format.
Before you can write this code, you need to know what XML is required for a given Flash object. The XML differs depending on the type of Flash object. The following example shows a basic single-series chart and the XML that defines its data and properties. Figure 18-8 shows a doughnut chart that displays a company’s revenue by business division.
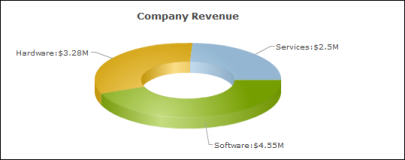
Listing 18-1 shows the XML that defines the data and properties of the doughnut chart.
|
Listing 18-1
|
<chart caption='Company Revenue' numberPrefix='$' labelSepChar=':'>
In a BIRT report, the values highlighted in bold are data values that are derived from a data set. Other XML attributes and values define the appearance of the chart. For example:
|
|
labelSepChar=':' specifies that the colon character be used to separate the data label and data values on the chart.
|
Even if you are not well-versed in XML, you quickly learn that chart data and formatting information are defined using the attribute='value' format. Notice that the sample XML is brief for a chart that looks presentable. Only two visual attributes are specified. The XML does not define attributes for fonts or colors. Every Flash object uses default values for visual attributes. You define attributes only to change default settings, or to add items that do not appear by default.
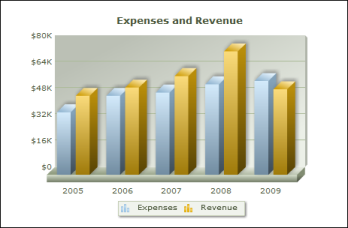
The next example shows a multi-series chart and the XML that defines its data and properties. Figure 18-9 shows a multi-series column chart that displays expenses and revenue from 2005 to 2009.
|
Figure 18-9
|
Listing 18-2 shows the XML that defines the data and properties of the multi-series chart.
|
Listing 18-2
|
<chart caption='Expenses and Revenue' showValues='0' decimals='0' numberPrefix='$'>
The values highlighted in bold are data values that are provided by a data set. Compared to the single-series doughnut chart, the XML for defining the data for a multi-series column chart is slightly more complex. The data for the multi-series chart is divided into three sections, whereas the data for the single-series doughnut chart is contained in one section.
Once you determine the XML needed to define the data and properties for a specific Flash object, perform the following tasks:
Use either JavaScript or Java, depending on the method you use to pass the XML to the Flash object, described next.
There are two ways to accomplish this task. Use either the dataXML variable or the dataURL variable to pass the XML to the Flash object.