Figure 21-1 showed examples of cross tab data aggregated by relative time periods. In all the examples, the current date is December 01, 2011. This section describes how those aggregations are defined.
Figure 21-3 shows using Current Year to calculate the sum of the Sales measure by region for the current year up to the current date. The dates used in the calculation are from the TransactionDate dimension. These settings result in the current year data displayed in the second cross tab shown in Figure 21-1.
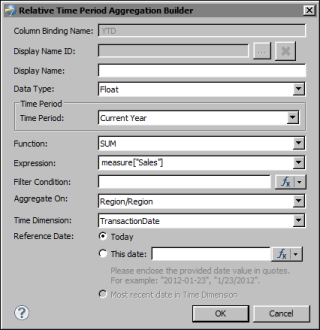
Figure 21-4 shows using Previous Year to calculate the sum of the Sales measure by region for the previous year. Number of Year(s) Ago is set to 1 to specify that data from one year ago is to be used in the calculation. Reference Date set to Today specifies that the previous one year is calculated from the current date. These settings result in the previous year data displayed in the second cross tab shown in Figure 21-1.

Figure 21-5 shows using Quarter to Date to calculate the sum of the Sales measure by region for the current quarter up to the current date. These settings result in the quarter-to-date data displayed in the third cross tab shown in Figure 21-1.
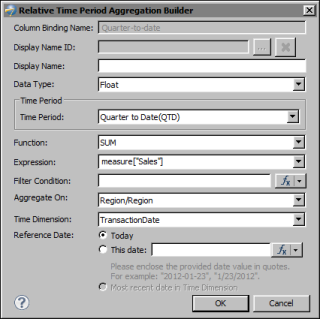
Figure 21-6 shows using Quarter to Date Last Year to calculate the sum of the Sales measure by region for the same quarter last year. Number of Year(s) Ago is set to 1 to specify that data for the quarter from one year ago is to be used in the calculation. These settings result in the same quarter, previous year data displayed in the third cross tab shown in Figure 21-1.
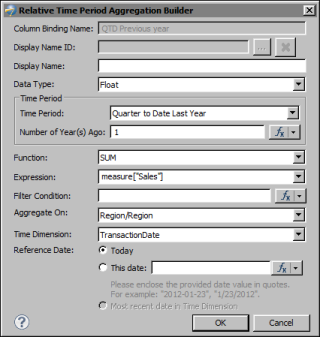
Figure 21-7 shows using Previous Quarter to calculate the sum of the Sales measure by region for the previous quarter. Number of Quarter(s) Ago is set to 1 to specify that data from one quarter ago is to be used in the calculation. These settings result in the previous quarter data displayed in the third cross tab shown in Figure 21-1.
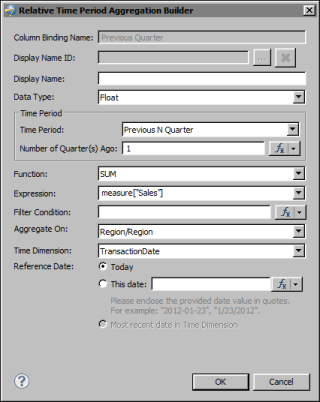
Figure 21-8 shows using Trailing N Days to calculate the sum of the Sales measure by region for a specified number of days prior to the current day. Number of Days(s) Ago is set to 15 to specify that data from the previous 15 days is to be used in the calculation. These settings result in the trailing 15 days data displayed in the fourth cross tab shown in Figure 21-1.
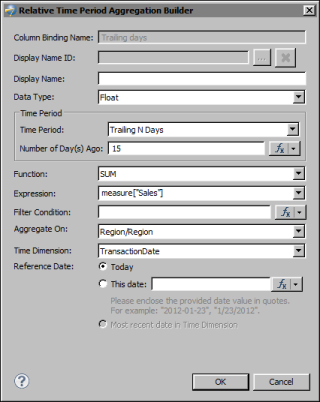
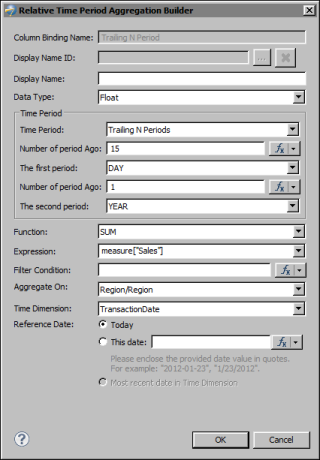
Figure 21-9 shows using Trailing N Periods to calculate the sum of the Sales measure by region for a specified number of days prior to the current day, but in the previous year. The first Number of Period Ago property is set to 15 and The First Period is set to DAY to specify that data from the previous 15 days is to be used in the calculation. The second Number of Period Ago property is set to 1 and The Second Period is set to YEAR to specify that the calculation is for the previous year. These settings result in the trailing 15 days, previous year data displayed in the fourth cross tab shown in Figure 21-1.