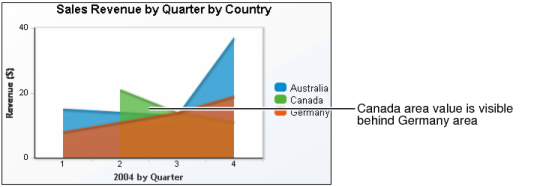
In an overlay area chart, multiple series overlay each other, as shown in Figure 6-4. Each shaded area represents the sales amount for a specific country. Where the Germany area overlaps the Canada area in the fourth quarter, the Canada area value is visible behind the Germany area. As the example shows, this chart subtype is not ideal for showing multiple series if the data values overlap. Consider using an overlay area chart if you want to show only one series, for example, only sales for Australia.
|
Figure 6-4
|