For a cross tab that presents a large amount of numeric data, it is useful to view a snapshot of the highest or lowest values, such as the top 100 order totals or the counties whose median home prices are in the bottom 10 percent. To display top or bottom values, use the Bottom N, Bottom Percent, Top N, or Top Percent operators.
For example, to display the top 100 values for OrderAmount, select Top N, and specify 100.
To display the bottom 10 percent of Productline revenues, select Bottom Percent, and specify 10. If there are 1000 rows of data, the cross tab displays 100 rows.
|
1
|
Right-click a cross-tab cell that contains data values to evaluate. From the menu, choose Filter→Top/Bottom N.
|
|
|
Select one of the following items to which to apply the filter. Depending on which cross-tab cell you right-clicked in step 1, Row or Column might not appear on Filter.
|
|
|
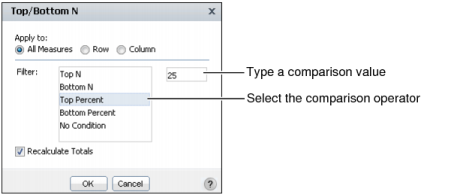
In Top/Bottom N, from the list, select the comparison test, or operator, to apply to the measure you right-clicked.
|
Figure 5-19 shows Top Percent selected. The specified comparison value is 25.