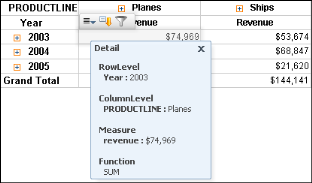
To view details of cross-tab data, right-click a cell in the data area. From the menu, choose Show Detail Tooltip. A tooltip displays the column and row-level details, the measure value, and which aggregate function applies for the selected cell, as shown in Figure 2-5. Displaying this detailed tooltip information is especially useful when analyzing data in a large cross tab in which you cannot simultaneously view the column heading, row heading, and cell in your browser window.
|
Figure 2-5
|