For a report or report element that presents a large amount of numeric data, it is useful to view a snapshot of the highest or lowest values, such as the top 100 order totals or the counties whose median home prices are in the bottom 10 percent.
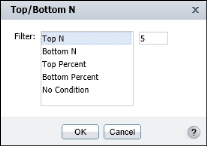
Select the column to highlight it, and choose Filter→Top/Bottom N from the context menu. Top/Bottom N appears, as shown in Figure 7-7.
On Top/Bottom N, select Top N, Bottom N, Top Percent, or Bottom Percent to specify the condition. Enter a number in the next field, and choose OK.
|
Figure 7-7
|
Filtering data using Top/Bottom N values
|