Side-by-side bar chart
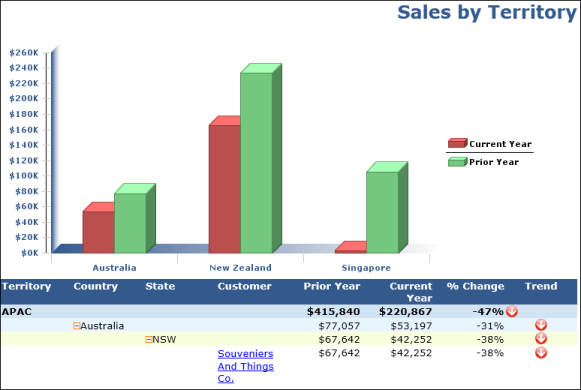
Side-by-side bar charts show bars from each series, one beside the other. Each of these bars have the same width. The width depends on the number of series being plotted. Figure 8-1 shows a side-by-side bar chart that graphically presents a company’s sales figures by geographical region.
|
Figure 8-1
|
Side-by-side bar chart
|