You can select two-dimensional subtypes for all charts. Choosing 2D displays the chart flat against the chart background. When you choose the 2D dimension for a column or bar chart, Interactive Viewer highlights the Use Glass Style field by default. This option displays the chart with rounded edges in a column or bar chart. Deselect this option to display a column or bar chart with sharp edges. Choosing 3D displays the chart against an additional axis to the existing x- and y-axes, providing greater depth. Choosing 2D with depth, also gives the chart an appearance of depth.
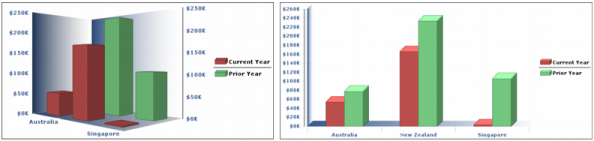
Figure 8-28 shows an example of a bar chart with a dimension setting of 3D on the left, and the same bar chart using a dimension setting of 2D with depth, on the right. Three-dimensional charts show how an object on the z-axis changes according to the x- and y-axes. The bar chart with two-dimensional depth setting gives the appearance of a three-dimensional object, but is arranged on the x- and y-axes only.