|
1
|
You can specify the title of value or y-axis for a chart. You can also specify the title for an additional y-axis, if the chart contains more than one.
|
|
5
|
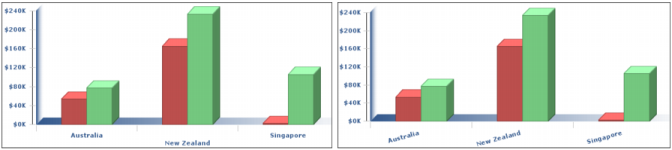
If label names are too long, or if the chart looks too crowded when you display all the labels, you can use Interactive Viewer to specify which labels to skip so that only the other labels appear on the chart. To skip labels, set the Interval value at which labels should appear. For example, to show every other label, use an Interval value of 2. To show every fifth label, use an Interval value of 5, and so on.You can also modify the font properties for labels by choosing Label Font. The example in Figure 8-30 shows a chart on the left with staggered labels, and one on the right with rotated labels.
|
|
Figure 8-30
|
You can modify the scale of the value axis using Interactive Viewer to fit the data that the axis displays. Category axes do not support scale changes. The scale determines the range of values on a linear, logarithmic, or date-and-time axis. You can use the axis scale to change the following settings:
Step Interval is the interval between each value on the value axis or the distance between major grid marks.
To set the scale of the y-axis, on Format Chart type values for minimum, maximum, and step interval in the Value (Y) axis area. The chart on the left in Figure 8-30 uses a scale between 0 and 240000 and a step value of 40000.