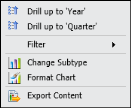
To drill up to a higher level in the data hierarchy, from the context menu, as shown in Figure 8-34, choose Drill up to 'Year' or Drill up to 'Quarter'.
|
Figure 8-34
|
In the following example, the category axis displays the Product Line, and the value axis displays sales. The data in the value series is grouped by year. You can drill down to view sales by product line for each year, or up to a higher level to view summary information across years.