BIRT reports support adding themes to a chart to apply common elements to similar charts. Access chart themes by exporting and then editing a theme or by creating a new theme. Implement Actuate JavaScript API functions within specific theme elements or in the script feature of the theme.
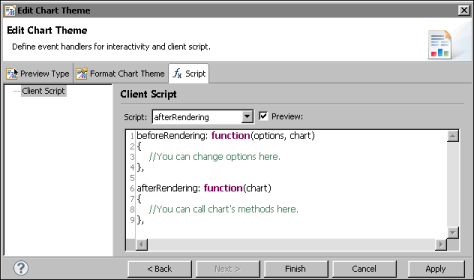
A chart theme supports executing a script before or after certain events, such as before rendering the chart. For example, you can add scripts for beforeGeneration, beforeRendering, beforeDrawAxis, beforeDrawSeries, beforeDrawDataPoint, and afterRendering when editing a chart theme, as shown in Figure 2-12.
|
Figure 2-12
|
In an HTML5 chart, you can use the actuate.report.HTML5Chart classes to alter the report display. For example, to render every data point in the series that is greater than avgValue in a green color, use code similar to the following: