A cube is a multidimensional data structure that is optimized for analysis. A cube supports applications that perform complex analyses without performing additional queries on the underlying data source. A cube organizes data into the following categories:
Dimensions are groups, such as customers, product lines, or time periods, which aggregate measures. For example, a sales revenue cube contains data that enables viewing sales volume and revenues, both of which are measures, by customers, product lines, and time periods, all of which are dimensions.
Dimensions can contain levels, which organize data into hierarchies. For example, a region dimension can contain a hierarchy of the country, state, and city levels. A time dimension can contain a hierarchy of the year, quarter, month, and day levels. Cubes frequently include time dimensions because displaying measures by time dimensions is useful in data analysis. The time dimension in a cube is a special dimension that supports storing data in developer-defined time periods.
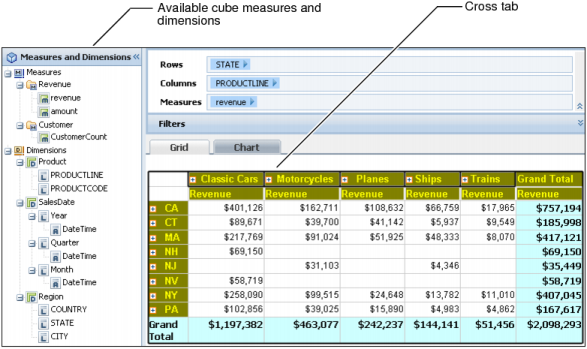
Use Actuate BIRT Designer Professional to create a cube using data from one or more data sources, then create a cross tab that uses the cube data and specifies the cross-tab appearance. The initial cross tab that appears in the Data Analyzer typically displays a portion of the available cube data in a simple layout. Figure 3-3 shows a cross tab and all of the cube measures and dimensions that are available for analysis.
|
Figure 3-3
|
See BIRT: A Field Guide for more information about data cubes and cross tabs.