Show or hide Data Analyzer viewer features with the actuate.xtabanalyzer.UIOptions class. The UIOptions class includes functions that support the ability to hide or show different features of the viewer. Figure 3-4 shows what functions affect the viewer display.
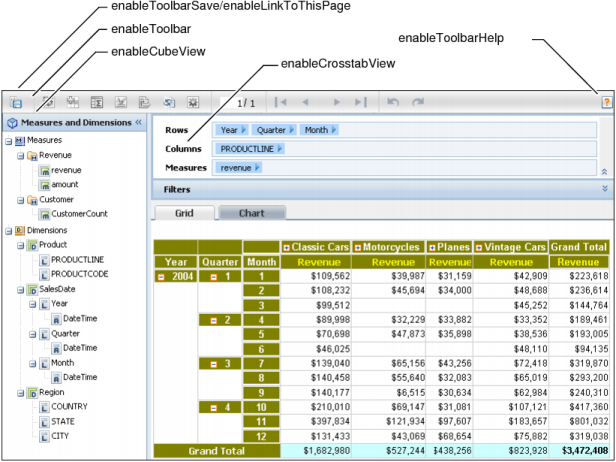
Pass true or false values to the UIOptions functions to display or hide the portion of the viewer that is associated with that particular function, as shown in the following code:
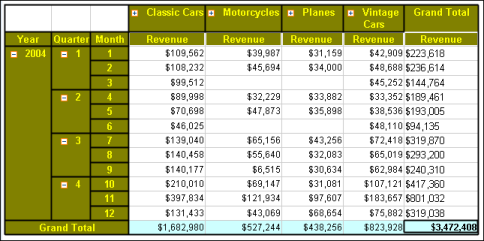
In addition to the UIOption class, some details shown within the viewer can be hidden with Crosstab.showDetail( ) and Crosstab.hideDetail( ).
For example, the cross tab in Figure 3-5 has a SalesDate dimension consisting of three levels: year, quarter, and month. The following code hides the detail from the quarter level of the dimension. In this example, crosstab is an actuate.xtabanalyzer.Crosstab object:
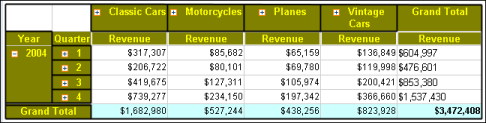
The code in this example modifies the cross tab so it longer shows the month detail level, as shown in Figure 3-6.
|
Figure 3-6
|