|
2
|
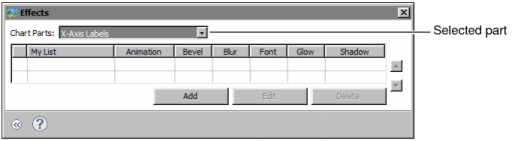
Choose Effects. Effects shows the part of the chart or gadget selected for an effect. Figure 17-25 shows an example of X-Axis Labels selected for a Flash chart.
|
|
5
|
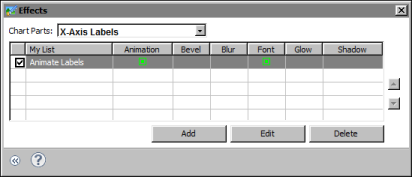
In Add New Effect, type a name for the effect, then choose OK. Effect, shown in Figure 17-26, lists the types of effects that you can apply. Animation is selected by default.
|

|
Figure 17-26
|
|
9
|
|
Figure 17-27
|