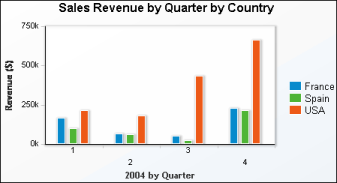
In a side-by-side column chart, multiple series appear as side-by-side columns. Each of these columns have the same width. The width depends on the number of series being plotted. Figure 6-10 shows a side-by-side column chart that graphically presents a company’s sales figures by country.
|
Figure 6-10
|