|
4
|
|
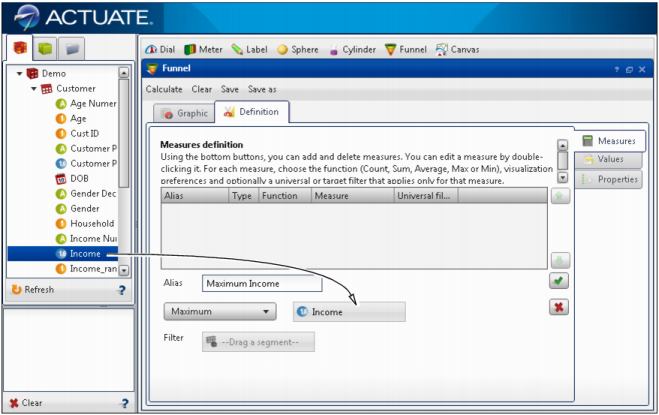
Figure 5-41
|
|
5
|
|
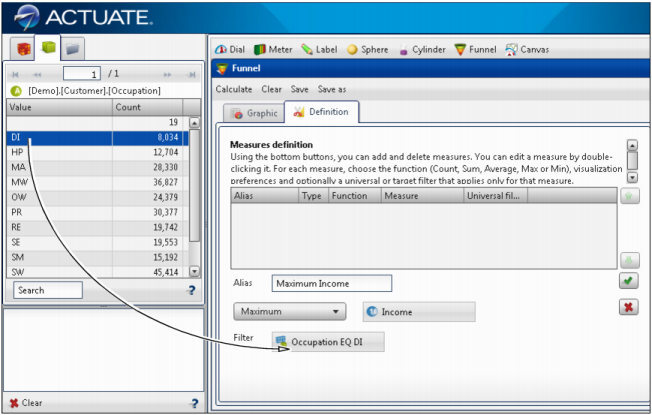
Figure 5-42
|
|
5
|
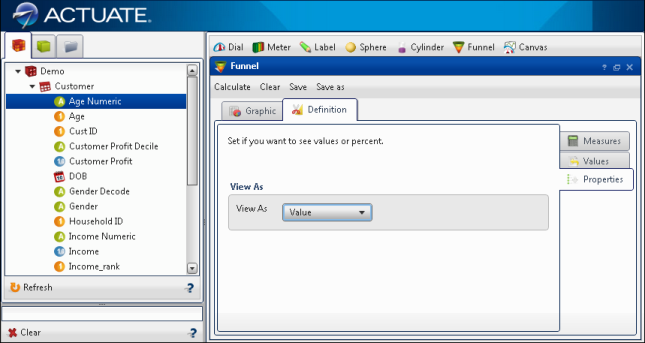
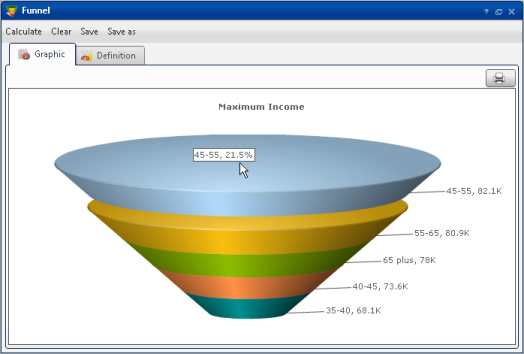
In View As, choose an option to represent the data. For example, Figure 5-44 shows choosing to view data as values.
|
|
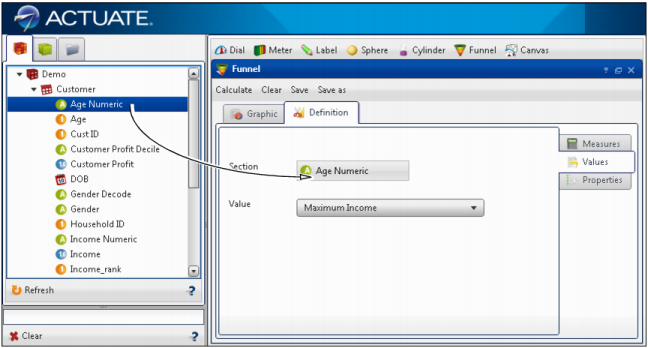
Figure 5-44
|
|
6
|
|
Figure 5-45
|
