|
4
|
|
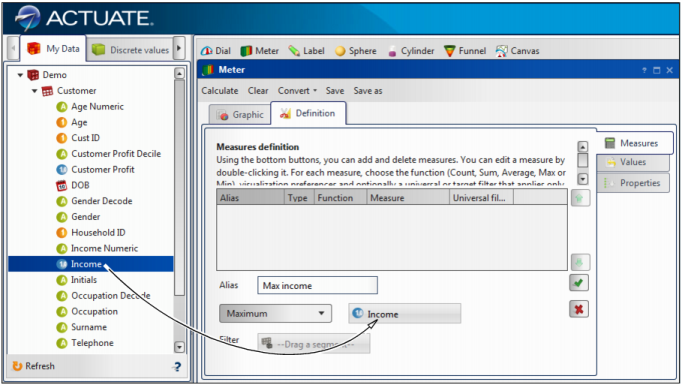
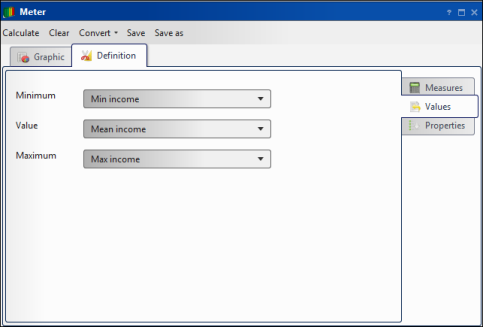
Figure 5-17
|
|
5
|
|
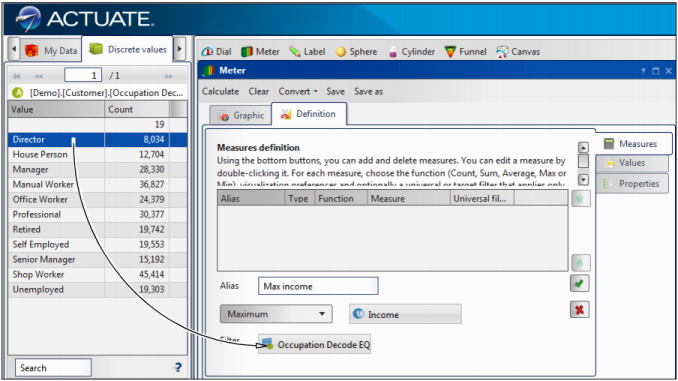
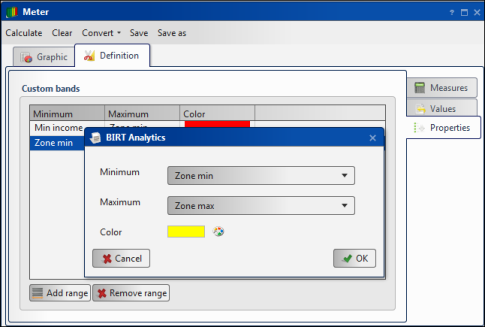
Figure 5-18
|
|
10
|
|
3
|
|
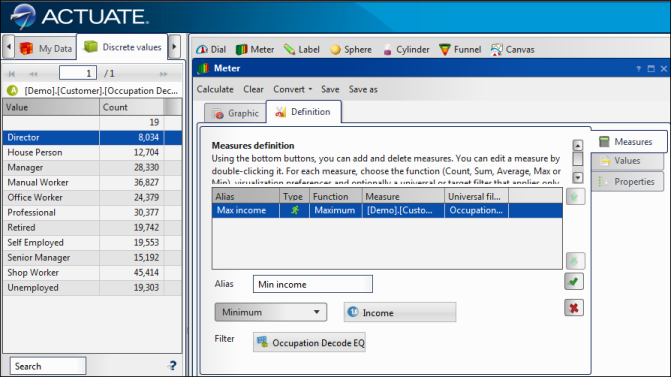
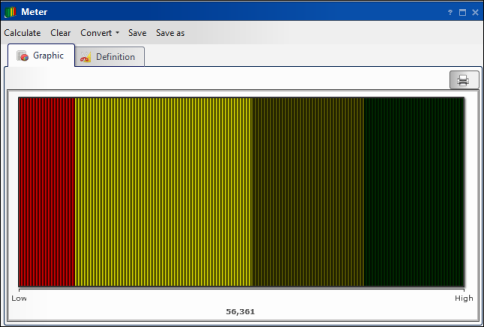
Figure 5-20
|
|
5
|
|
7
|
|
3
|
|
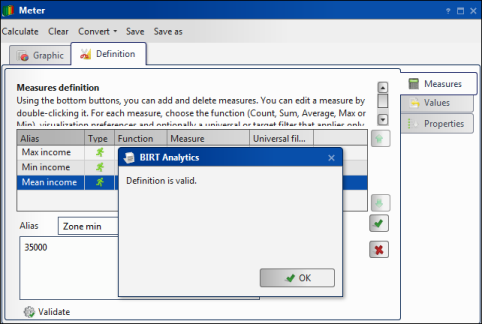
Figure 5-22
|
|
5
|
|
6
|
|
Figure 5-23
|
