Figure 6-1 shows the distribution of raw, or non-standardized, data for age and income. Ages fall in the 19 to 93 range, while incomes fall in the 479.79 to 111571.4 range. To compare these distributions, you must standardize the data.
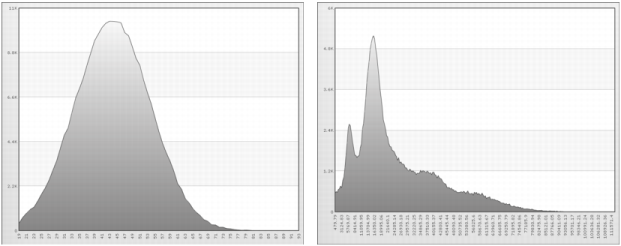
Figure 6-2 shows normalized data for age and income. The values on the horizontal axis represent the number of standard deviations from the mean. The standard deviation of the mean is 0.
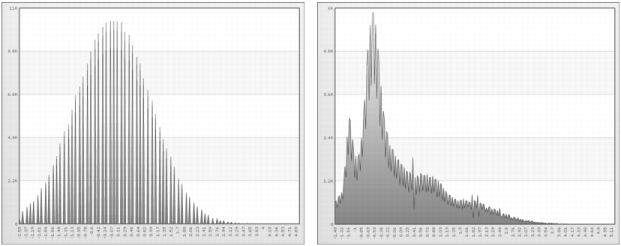
Figure 6-3 shows linear scaling with the original minimum and maximum values for age and income.
|
Figure 6-3
|
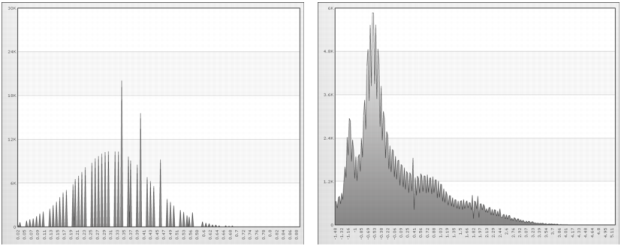
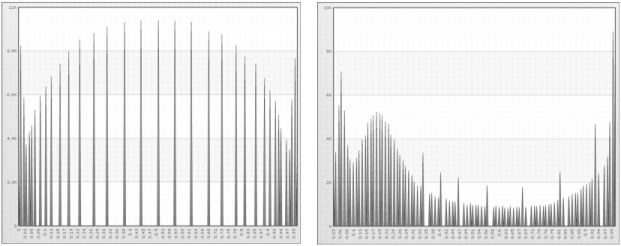
Figure 6-4 shows linear scaling with a stretch to the minimum and maximum values for age and income.
|
Figure 6-4
|
x’ = x - E(x) / λ(σx/2π)
|
|
λ is the confidence level.
|
|
|
σx is the standard deviation of the study variable.
|
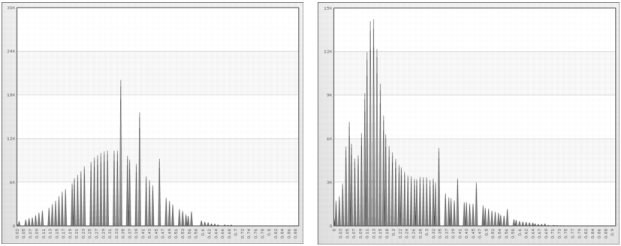
Figure 6-5 shows Softmax scaling at 68% for age and income.
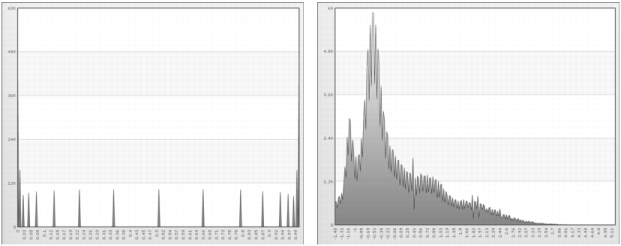
Figure 6-6 shows Softmax scaling at 95% for age and income.
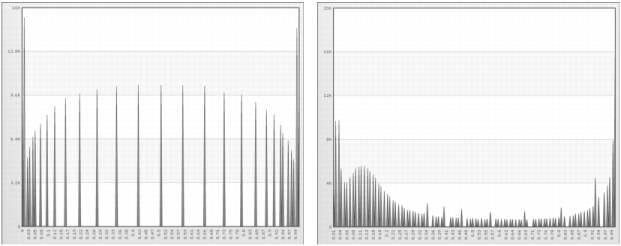
Figure 6-7 shows Softmax scaling at 99% for age and income.
|
1
|
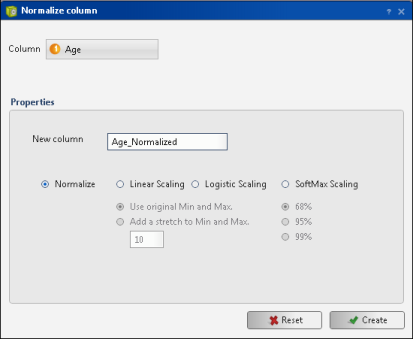
In Analytics—Advanced, choose Preprocessing→Normalize Column.
|
|
2
|
|
Figure 6-8
|
