Using profile analyses
Video tutorials
A profile analysis groups values and determines their relatedness to another group, called the profile segment. This analysis helps you draw a profile of a group of values from attributes selected in Data Tree.
In advertising, a target group refers to the people to whom the advertising is directed. The target group is equivalent to a profile segment. If a profile segment is chosen, the profile carries out a comparison with each of the attributes that are selected based on all the database’s values, including the analysis segment itself. In other words, a request is made for an analysis of the significance of the attributes to define the segment, versus all other values in the database.
Alternatively, if a base segment is selected in addition to the profile segment, the analysis is based on the values that are part of that chosen segment. In the first case the segment is defined. In the second case, whether the attributes are suitable for showing differences between both groups (profile and base segment) is defined. Three different scenarios are possible:
*
*
*
There are several indicators that measure the significance of the attributes to define the analysis segment, including Z-score. The Z-score determines whether the difference between two proportions is statistically significant. In the case of profile, this determination is carried out between the group to be analyzed and the group considered Rest, values that belong to the attribute whose significance you want to measure but not to the analysis segment.
The Z-score uses the binomial for unequal variances, whose formula is:
Z = (p1-p2)/sqrt((p1*(1-p1)/n1 + (p2*(1-p2)/n2))
where
*
*
Table 4-2  
In other words:
*
*
*
*
*
*
*
A Z-score higher than 0 can be considered significant to describe a segment, but values below 1.96 cannot be considered statistically significant. Only values above this threshold can be considered significant. You set attributes of which you want to measure the significance, which means that other values that are not chosen for the study may be the ones that are truly statistically significant to define the analysis segment.
How to create a Profile analysis
1  
2  
3  
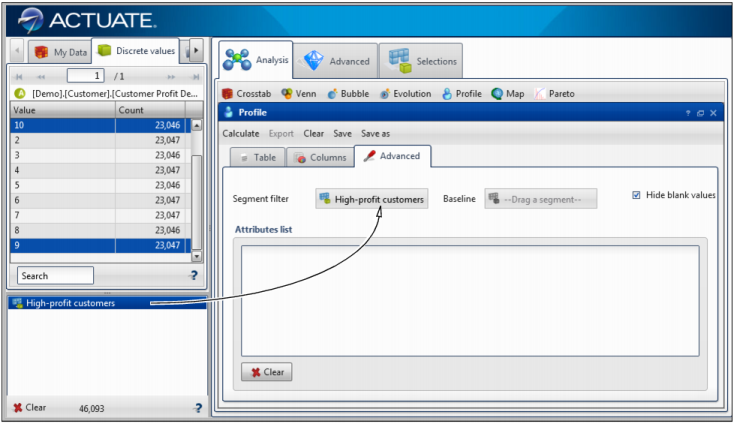
To create a segment, drag one or more values from Discrete Values to Scratchpad, as shown in Figure 4-25. Alternatively, use an existing segment. The segment of data represents a profile group against which you test the significance of various attributes.
Figure 4-25  
4  
5  
Figure 4-26  
6  
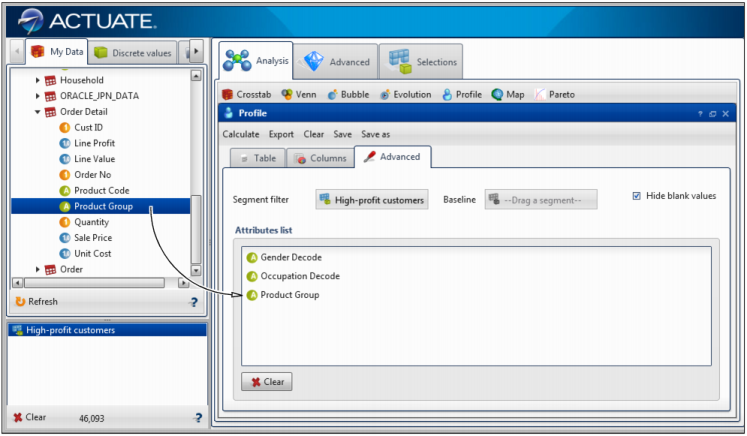
Drag fields from Data Tree into Attributes list, as shown in Figure 4-27. Using the Profile analysis, you test these attributes for how significantly they contribute to the profile.
Figure 4-27  
7  
8  
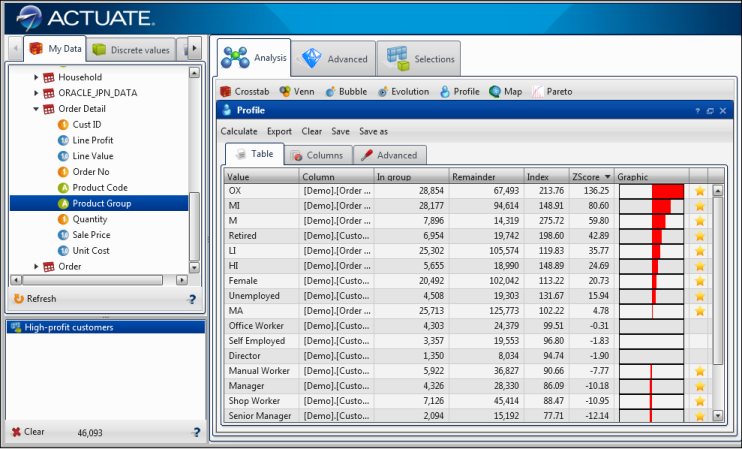
Examine the results on Table. The red bars in the Graphic column show which discrete values from the list of attributes contribute most significantly to the profile, as shown in Figure 4-28. Note that the red bars represent the Z-score, and the column is sorted by default from most significant to least significant.
Figure 4-28  
Related topics
Using BIRT Analytics basic tools
Understanding the sample data model
Video tutorials
Creating a profile analysis
Comparing groups using a profile analysis

Additional Links:

Copyright Actuate Corporation 2013 BIRT Analytics 4.2