Understanding table resolution
BIRT Analytics supports saving your selections, queries and analyses for reuse. To retrieve records from a different part of your database, replace the table from which you retrieved records in a previous selection, query, or analysis, then recalculate the results. To demonstrate how the concept of table resolution works in practice, this section presents examples that demonstrate viewing different tables in the BIRT Analytics demo database using Data Explorer.
Viewing results of simple queries
Examining results returned by a simple query from one database table shows the discrete values in that table. For example, using My Data, expand the Household table, then double-click Property Types Decode. In Discrete Values, you see 28,514 records for households having the type Bungalow.
For a similar example, expand Customers, then double-click Gender. In Discrete Values, you see 102,042 F and 157,832 M records, which represent 102,042 female and 157,832 male customers in the database. To resolve questions about customers in each household, you can change the resolution or perspective of your query.
Changing table resolution
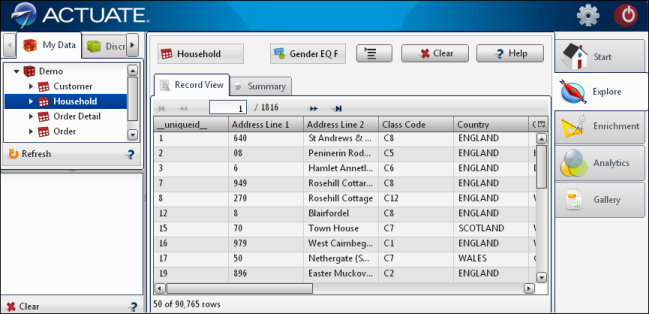
To demonstrate changing table resolution, modify the second example from the preceding section in the following way. Drag the Female value from Discrete Values and drop it in Record View of Data Explorer. You see complete records for 102,042 female customers. Choose My Data, then replace Customer with Household. To do this task, drag Household from My Data and drop it on Customer in Data Explorer. 90,765 records that represent households having one or more female customers appear in Record View, as shown in Figure 2-10.
Figure 2-10  
Changing the table on which a query resolves returns results different than those returned by a simple query. To return expected results, the tables you replace must relate or join on a common field.

Additional Links:

Copyright Actuate Corporation 2013 BIRT Analytics 4.2