Planning the data
Before building a data set or a cube, think about the aggregate data you want to display in the cross tab, and how you want to categorize the aggregate data. For example:

Average score and high score by year by school district
Sales volume by month by product by store
Call volume and average call time by support person by day and by call type
After deciding the information to display in the cross tab, you can identify which data fields to define as measures and dimensions in the cube. In the first example, the measures are average score and high score, and the dimensions are year and school district.
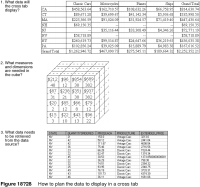
After identifying the contents of the cube, you know what data to retrieve from the data source. Figure 18‑28 shows the data planning flow.
Notice that the planning steps are in the reverse order of the implementation steps. Start with the end result and work backward to determine the best way to get the results you want. If you have control of the data source as well—the database, for example—you can go a step further and create a database schema that supports the queries to return data for a cube.
Most report developers, however, neither create nor maintain corporate databases or other information systems. The rest of this section provides some guidelines for designing data sets and cubes, given the typical ways databases are structured.