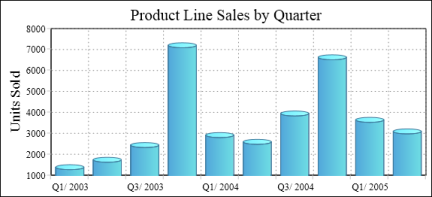
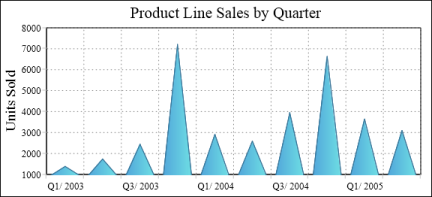
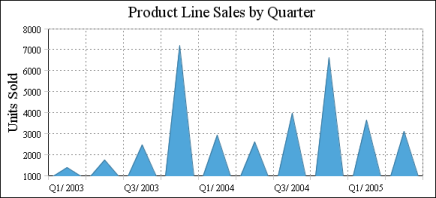
The example chart shown in Figure 8-4, Figure 8-5, and Figure 8-6 uses the same data, sales of a product line across quarters, to illustrate these different chart types.
|
Figure 8-4
|
|
Figure 8-5
|
|
Figure 8-6
|