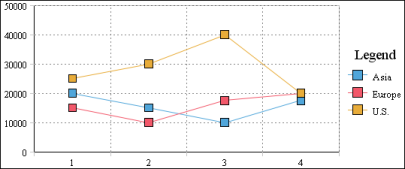
In an overlay line chart, multiple series appear as overlapping lines, as shown in Figure 8-12. The squares mark each data value. Overlay line charts show lines from each series independent of the others. The lines appear joining the values for the series.