Bar stick stock charts consist of a vertical line with two horizontal lines called ticks attached to it. The upper and lower points of the vertical line are the stock open and close values. The ticks are the high and low values, as shown in Figure 8-20.
|
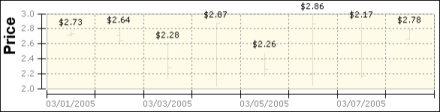
Figure 8-20
|
The chart in Figure 8-18 shows that the stock posted a gain on the fourth and sixth day in the trading week and a loss on the other five days. The example in Figure 8-20 shows a stock with moderate fluctuation. When the stock is volatile on a given day, the two horizontal lines can appear far above or below the vertical line. As you can see from the examples, the candlestick stock chart shows the gain or loss pattern more clearly than the bar stick stock chart.