How to modify the axes labels of a chart
On Format Chart, complete the following steps:
1  
You can specify the title of value or y-axis for a chart. You can also specify the title for an additional y-axis, if the chart contains more than one.
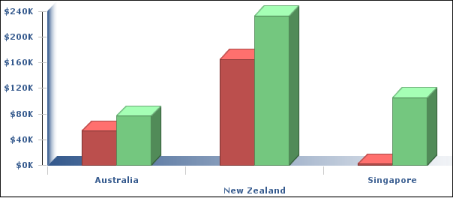
2  
3  
4  
5  
Figure 8-30  
Modifying scale
You can modify the scale of the value axis using Interactive Viewer to fit the data that the axis displays. Category axes do not support scale changes. The scale determines the range of values on a linear, logarithmic, or date-and-time axis. You can use the axis scale to change the following settings:
*
*
Step interval is the interval between each value on the value axis or the distance between major grid marks.
To set the scale of the y-axis, on Format Chart, type values for minimum, maximum, and step interval in the Value (Y) axis area. The chart on the left in Figure 8-30 uses a scale between 0 and 240000 and a step value of 40000.

Additional Links:

© Copyright OpenText Corp. All rights reserved. Privacy Policy | Cookie Policy

BIRT iHub 2