|
1
|
|
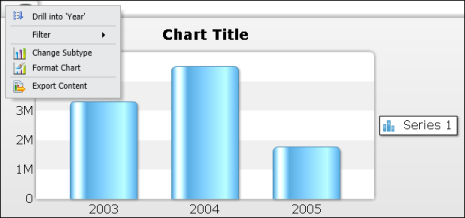
Figure 8-31
|
|
2
|
|
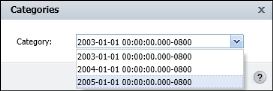
Figure 8-32
|
|
3
|