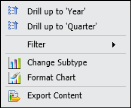
To drill up to a higher level in the data hierarchy, from the context menu, as shown in Figure 8-34, choose Drill up to 'Year' or Drill up to 'Quarter'.
|
Figure 8-34
|
To drill up to a higher level in the data hierarchy, from the context menu, as shown in Figure 8-34, choose Drill up to 'Year' or Drill up to 'Quarter'.
|
|
|
© Copyright OpenText Corp. All rights reserved. Privacy Policy | Cookie Policy |
BIRT iHub 2 |
|