|
1
|
|
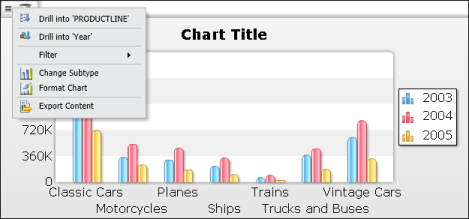
Figure 8-35
|
|
2
|
|
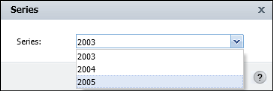
Figure 8-36
|
|
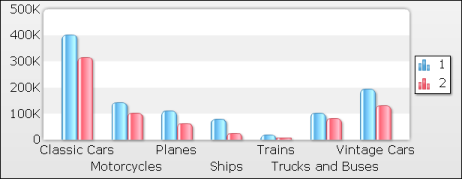
Figure 8-37
|
|
3
|