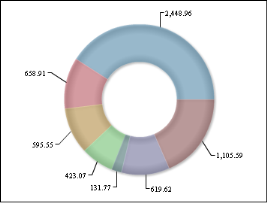
The example in Figure 8-40 shows a doughnut chart on the left, and a segmented doughnut chart on the right.
|
Figure 8-40
|
The example in Figure 8-40 shows a doughnut chart on the left, and a segmented doughnut chart on the right.
|
|
|
© Copyright OpenText Corp. All rights reserved. Privacy Policy | Cookie Policy |
BIRT iHub 2 |
|