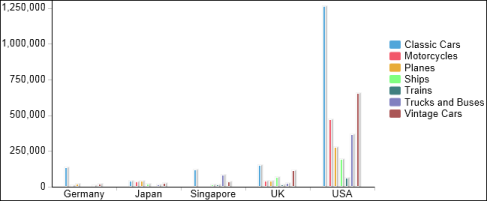
Information about working with regular charts, Flash charts, and Flash objects in a report is provided in an earlier section in this document. The following section describes how you can use Interactive Viewer to work with HTML5 charts to modify formatting properties, create filters to view specific data, export data and export the charts to various supported formats. Figure 8-54 shows an example of an HTML5 bar chart displaying total sales by country and produce line.
|
Figure 8-54
|

