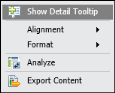
To view details about cross tab data, select a cell in the data area. From the context menu, choose Show Detail Tooltip, as shown in Figure 9-3.
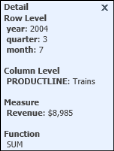
Now when you select any cell in the display area of the cross tab, the tooltip for that data value appears. A tooltip displays the column and row level details and the measure value, as shown in Figure 9-4.
|
Figure 9-4
|