|
|
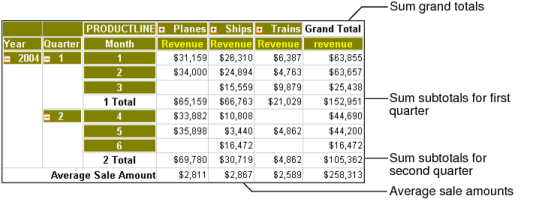
Data Analyzer displays the specified grand totals and subtotals. For example, Figure 4-6 displays the average sale amounts, based on detail rows in the data source, in the Average Sale Amount row, and the sum grand totals in the Grand Total column. Also, the figure displays first-quarter and second-quarter subtotals in the Planes, Ships, and Trains columns.