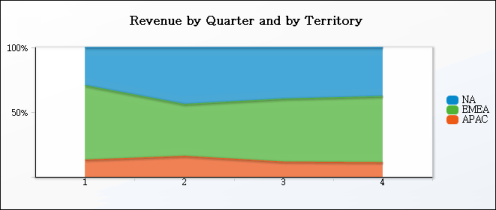
In a percent stacked area chart, multiple series are stacked vertically and the values are shown as a percentage of the whole. As you can see in Figure 6-6, the sales values are shown in percentages, instead of the actual numbers as shown in the previous area chart.