|
Figure 6-17
|
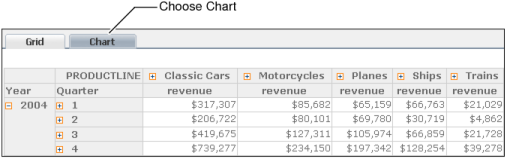
The chart appears, displaying the cross tab data, as shown in Figure 6-18. This column chart, the default chart type, displays the sales revenue for each product line for 2004.

|
Figure 6-18
|