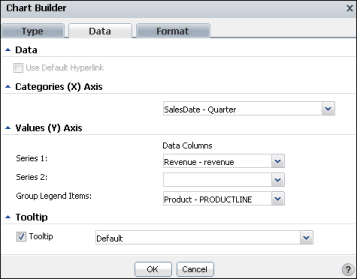
To customize an area, bar, column, line, or scatter chart, you can change the following values using Chart Builder—Data. Figure 6-24 displays values for a chart using the cross tab values in the sample report document, Crosstab Sample Revenue.rptdocument.
|
Figure 6-24
|
|
|
In Categories (X Axis):
|
From the items in the list, select which category to display on the x-axis. For example, the sample chart can display values for the product line series for the year, for the four quarters of the year, for the twelve months of the year, or for each product line with no time-period grouping. Figure 6-24 displays the selection of SalesDate - Quarter.
|
|
In Values (Y Axis):
|
From the available items in the list, select which value to display in a tooltip when you hover the pointer over an item in the chart. In the sample chart, for example, the default values that appear when the pointer hovers over a chart column are the category name, x-axis data value, and y-axis data value for the column. You can change the value to display a different value, such as Category Data, Value Series Name, or Value Data.