To customize a doughnut or pie chart, you can change the following values using Chart Builder—Data. Figure 6-25 displays values for a chart using the cross tab values in the sample report document, Crosstab Sample Revenue.rptdocument.
|
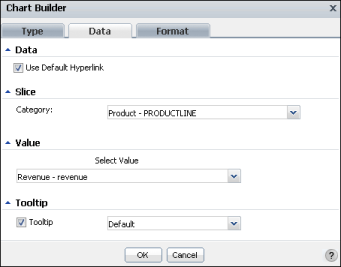
Figure 6-25
|
From the items in the list, select which category to display as a slice, or segment, of the pie chart. For example, the sample chart can display revenue values for the 12 months of the year, the 4 quarters of the year, the entire year, or for each product line. Figure 6-25 displays the selection of Product - PRODUCTLINE.