When you display a chart and use the default formatting options, the chart type and the data you selected determine the basic chart appearance. You can enhance the chart by providing text for the chart title, x-axis title, and y-axis title, and by changing the size or position of the axis labels. You can also change the font, size, and color for text.
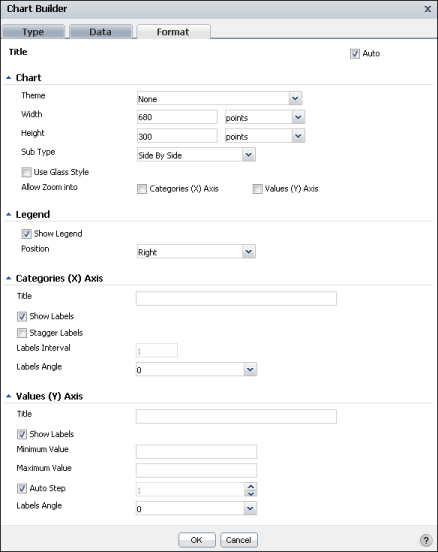
To change the appearance of a chart, change the option settings in Chart Builder—Format. Figure 6-30 shows Chart Builder—Format, displaying the default options settings for a column chart. The options that appear differ depending on the chart type. The following topics describe the options.