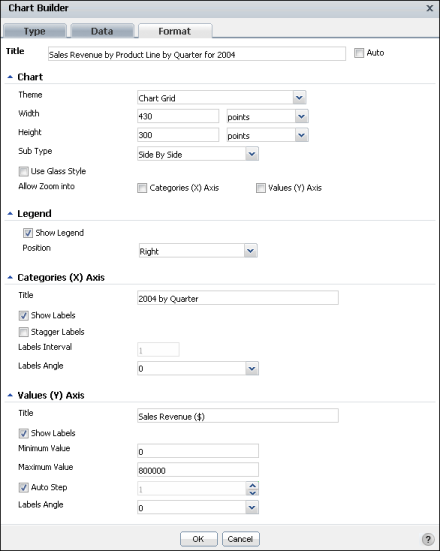
For example, Figure 6-34 shows format selections for a sample bar chart. Notice for this chart, the Categories (X Axis) Title appears on the vertical axis on the left, and the Values (Y Axis) Title appears on the horizontal axis at the bottom, which are reversed from the positions for a column chart.
|
Figure 6-34
|
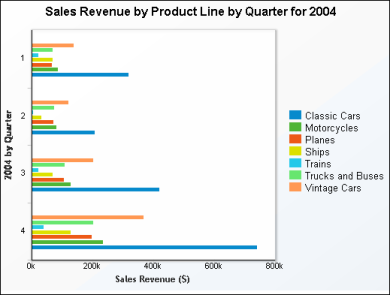
The chart updates, reflecting your changes. Figure 6-35 shows a bar chart with the formatting applied.
|
Figure 6-35
|