For more information about comparison operators, see Operators supported in conditional formatting and filter condition expressions.
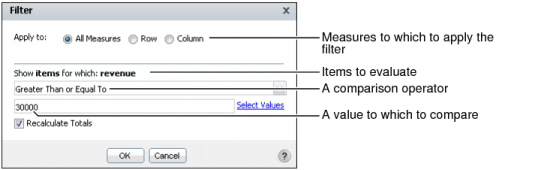
Figure 5-1 shows an example of a filter condition to apply to a revenue value, a measure. When defining this filter condition, you can break it down into the following parts, as shown in Figure 5-1:
|
Figure 5-1
|
|
Figure 5-2
|
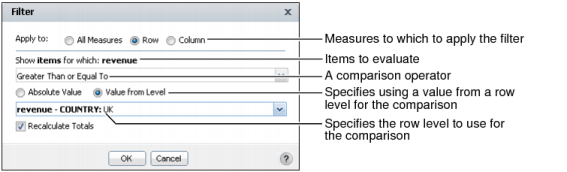
Figure 5-3 shows an example of a filter condition to compare revenue values in the Spain row to revenue values in the UK row. When defining a filter condition, you break it down into the following parts, as shown in Figure 5-3:
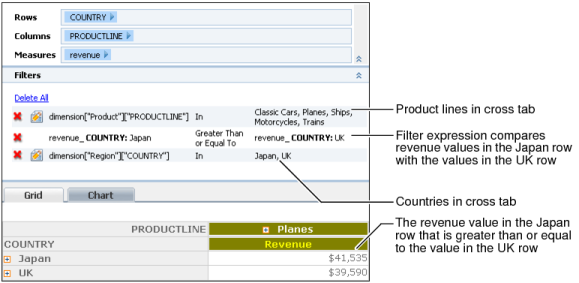
The cross tab displays the revenue value in the Japan row that is greater than or equal to revenues in the UK row. Also, the filters pane displays the applied filters, as shown in Figure 5-4.
|
Figure 5-4
|
Also, you can create a filter that applies to an attribute or dimension, which does not appear in the cross tab preview pane. For example, apply a filter to an attribute or dimension that appears in the cube data, and which narrows the scope of the data that appears in the cross tab. Figure 5-5 shows a cross tab in which the following filter applies to the cube data:
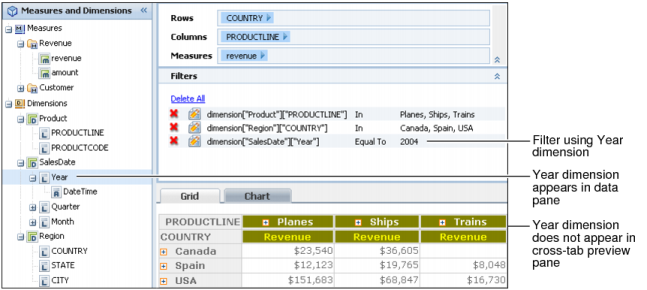
For more information about comparison operators to use when you create filter condition expressions, see Operators supported in conditional formatting and filter condition expressions.
|
2
|
In Filter, select one of the following to which to apply the filter. Depending on which cross tab cell you right-clicked in step 1, Row or Column might not appear on Filter.
|
|
3
|
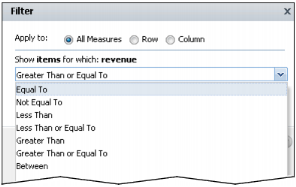
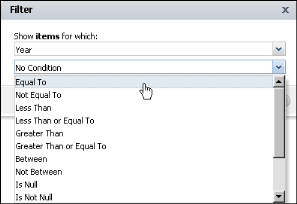
In Filter, from the list shown in Figure 5-6, select the comparison test, or operator, to apply to the attribute, dimension, or measure. Depending on the comparison operator you select, Filter displays either one or two additional fields or a completed filter condition.
|
|
Figure 5-6
|
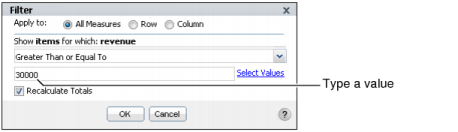
|
Figure 5-7
|
|
|
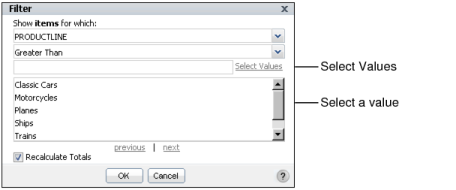
Choose Select Values to select from a list of existing data values. Figure 5-8 shows how you can select product line values from a list. When they are available, use the previous and next buttons to display more values.
|
|
Figure 5-8
|
|
|
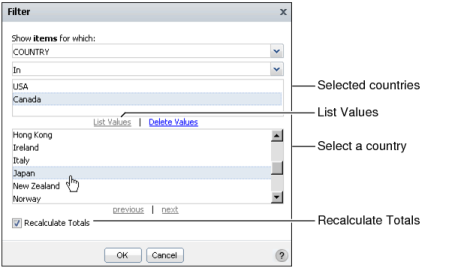
Choose List Values to select from a list of existing data values. Figure 5-9 shows how you can select country values from a list for the In operator. When they are available, use the previous and next buttons to display more values.
|
|
Figure 5-9
|
|
1
|
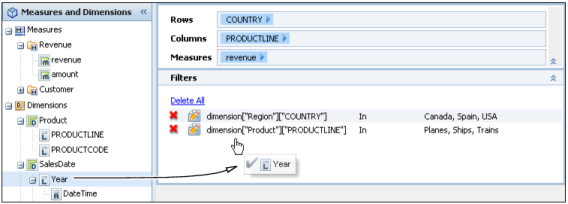
From the data pane, drag an attribute or dimension, and drop it in the Filters area of the structure pane. For example, Figure 5-10 shows dragging the Year dimension to the Filters area.
|
|
2
|
|
Figure 5-11
|
|
Figure 5-12
|
|
|
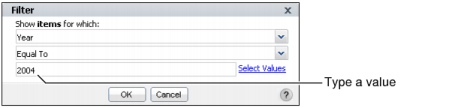
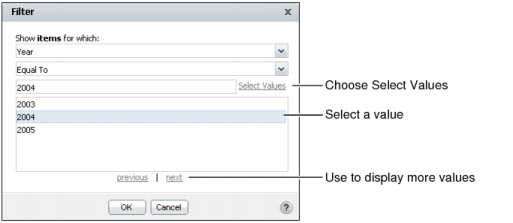
Choose Select Values to select one value from a list of existing data values. Figure 5-13 shows how you can select a Year value from a list. If they are available, you can use the previous and next buttons to display more values.
|
|
Figure 5-13
|
|
|
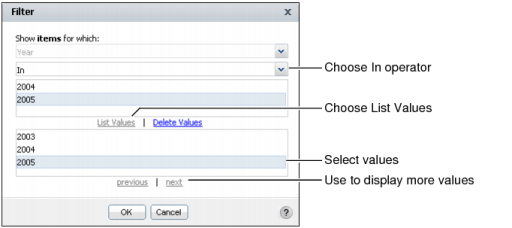
Choose List Values to select one or more values from a list. For example, the In operator supports selecting multiple values. Figure 5-14 shows selecting two Year values for the In operator. If they are available, use the previous and next buttons to display more values.
|
|
Figure 5-14
|